The INtegrated Rate Law
|
Another Way to Determine the Rate Law
Using several experiments of the same reaction and changing the concentrations of the reactant(s) is only one way to determine the rate law. Another way involves measuring the amount of a reactant as the reaction proceeds (versus time). When you do that, you will get data that looks like the data below 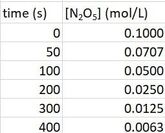
which, when plotted on a graph, will look like what is to the right:
|
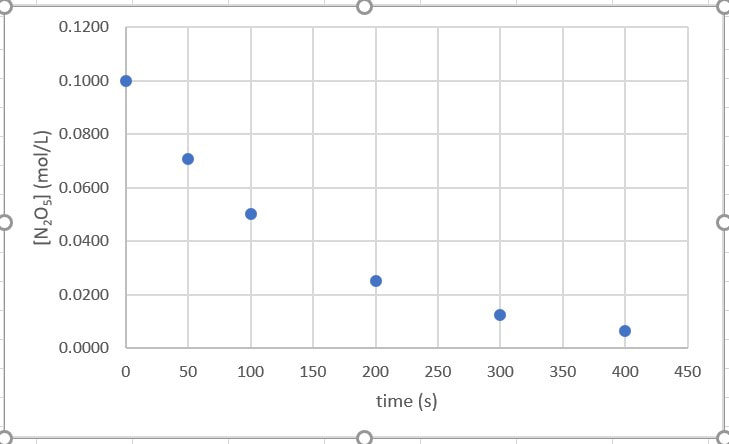
So, how do you determine whether this is zero order, first order or second order, in regards to this reactant. Well, let's dissect each one:
|
Zero Order Reactions
Zero order reactions are reactions in which the rate is not dependent on the concentration of the reactants. In other words, the reaction will go the same speed no matter how much reactant there is. One reaction that has a zero order rate law is
Zero order reactions are reactions in which the rate is not dependent on the concentration of the reactants. In other words, the reaction will go the same speed no matter how much reactant there is. One reaction that has a zero order rate law is
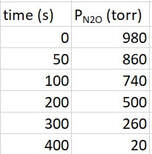
2 N2O (g) --> 2 N2 (g) + O2 (g)
The rate law will look like this:
Rate = k
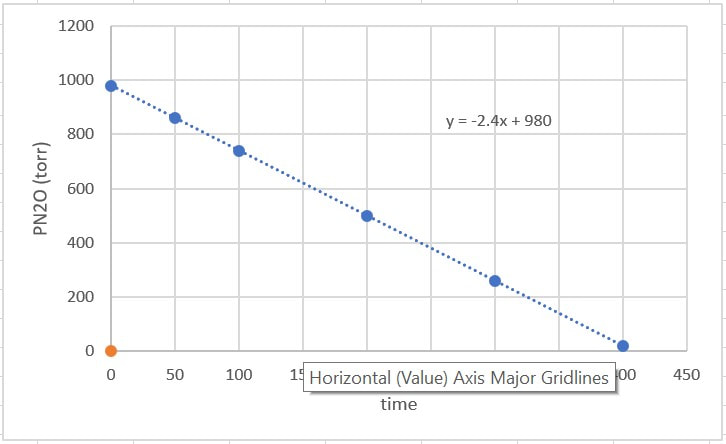
The data will look similar to this, and when the graph is plotted it will look like this:
|
|
When you plot the data, the line is a straight line going down. That's the key. Since the line is already straight for the data, this means there is a direct relationship between the amount of reactant and time. What's more, the slope of -2.4 = -k. The slope of the line is the negative value of k, so k = 2.4 torr.
To reiterate, if you plot the concentration reactant versus time, and the line is already straight, then the rate law is zero order in regards to that reactant.
First Order Reactions
First order reactions, unlike zero order, will form a curved line when plotted. One example of a reaction that is first order is
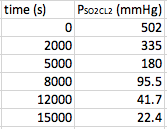
SO2Cl2 (g) --> SO2 (g) + Cl2 (g)
The rate law will look like this:
Rate = k[SO2Cl2]
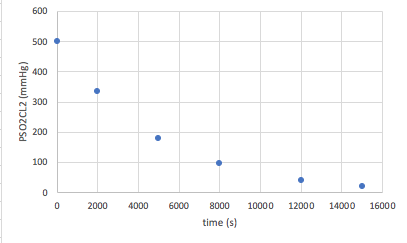
Again, you will be given a set of data that plots time versus a concentration (or partial pressure). An example of the data that you will see, and the curve it makes will look like this:
|
|
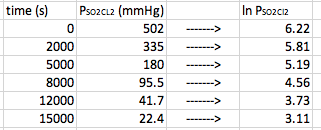
This time, the data does not form a straight line. In this case, we need to find out what form of manipulation of the data will give us a straight line. When you plot the natural log of the concentration versus time, first order reactions will give you a straight line. Therefore in this case, we need to take the data and convert the [concentration] in to ln[concentration]. In other words, take the natural log of each concentration/partial pressure:
|
So how did we get this new column. Well put simply, just hit the ln button on you calculator and type in 502.
ln 502 = 6.22
ln 335 = 5.81 |
Now, when we plot the new data, we get our data points to make a straight line. We can then find the equation for the points.
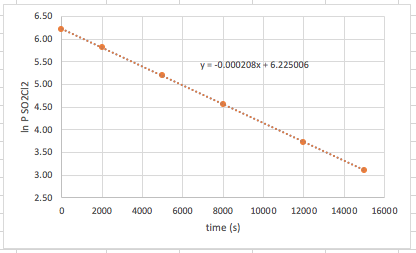
So, a couple of things here: #1: We know that the reaction is first order in regards to the reactant because plotting the ln[conc] versus time gives us a straight line. #2: The slope of this line is also -k. So, in this case, k = 0.000208 1/s. Please do not be confused by the units. We simply substituted molarity (M), which we normally used for pressure (mmHg). The pressure of the gas is directly related to the molarity through the ideal gas law, so it is a simple substitution. We would have achieved the same rate law had we used molarity (or moles).
On the AP test, you will be given the following equation:
On the AP test, you will be given the following equation:
ln[A]t - ln[A]0 = -kt
where [A]t is the concentration of A (the reactant) at time "t"
[A]0 is the concentration of A at time 0
k is the rate constant
and t is the time chosen
You can use this equation if a) you know the reaction is first order, and b) you need to find one of these things, and you have the other three. Usually, this is used in regards to finding the rate law constant.
Second Order Reactions
Just like first order reactions, a second order reaction will form a curved line when plotted. One example of a reaction that is second order is
Second Order Reactions
Just like first order reactions, a second order reaction will form a curved line when plotted. One example of a reaction that is second order is
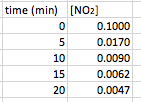
2 NO2 (g) --> 2 N2 (g) + O2 (g)
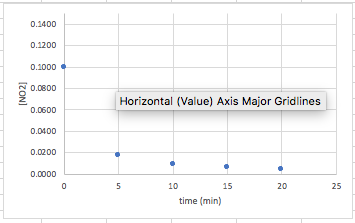
Again, you will be given a set of data that plots time versus a concentration (or partial pressure). An example of the data that you will see, and the curve it makes will look like this:
|
|
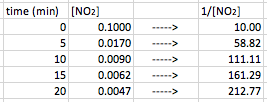
Again, the data does not form a straight line. In this case, we need to find out what form of manipulation of the data will give us a straight line going up this time instead of down. When you plot the inverse of the concentration (1/[conc]) versus time, second order reactions will give you a straight line. Therefore in this case, we need to take the data and convert the [concentration] in to 1/[concentration]. In other words, take the inverse of each concentration/partial pressure:
|
For instance
1/0.1000 = 10.00 1/.0170 = 58.82 |
Now, when we plot the new data, we get our data points to make a straight line. We can then find the equation for the points.
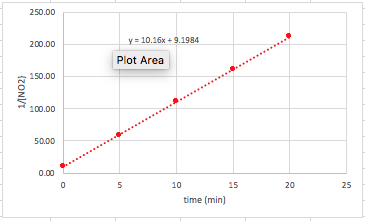
So, a couple more things here: #1: We know that the reaction is second order in regards to the reactant because plotting the 1/[conc] versus time gives us a straight line. #2: The slope of this line is k. So, in this case, k = 10.2 1/ M*s.
On the AP test, you will be given the following equation:
On the AP test, you will be given the following equation:
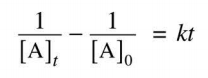
where [A]t is the concentration of A (the reactant) at time "t"
[A]0 is the concentration of A at time 0
k is the rate constant
and t is the time chosen
You can use this equation if a) you know the reaction is second order, and b) you need to find one of these things, and you have the other three. Usually, this is used in regards to finding the rate law constant.
