Phase Diagrams
States of matter can be changed by adding or removing heat. We already know that. In addition, we already know the names of these phase changes. But, as a quick reminder:
But, these phase changes can also be accomplished by changing the pressure. We learned that a liquid will boil when its vapor pressure is equal to the atmospheric pressure. If we put a liquid in a low enough pressure environment, the liquid will boil even if the temperature is below its boiling point.
- solid to liquid - melting
- liquid to gas - boiling or vaporization
- solid to gas - sublimation
- liquid to solid - freezing
- gas to liquid - condensation
- gas to solid - deposition
But, these phase changes can also be accomplished by changing the pressure. We learned that a liquid will boil when its vapor pressure is equal to the atmospheric pressure. If we put a liquid in a low enough pressure environment, the liquid will boil even if the temperature is below its boiling point.
|
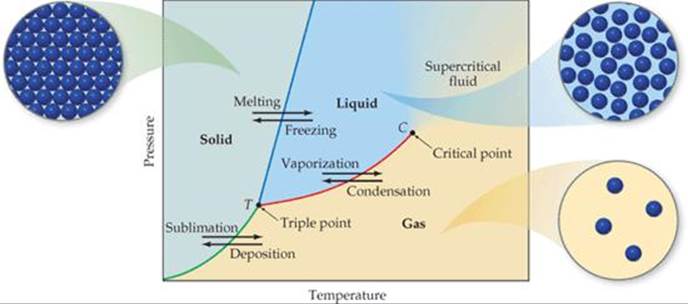
Therefore, both temperature and pressure are components to state changes. Since this is true, scientists have developed things called phase diagrams which show what state of matter a substance will be in depending on the pressure and temperature conditions it is under. An example of a phase diagram is to the right:
In every phase diagram, pressure is on the y axis and temperature is on the x axis. Gases are on the bottom right (low pressure, high temperature) and solids are on the top left (high pressure and low temperature). Liquid are in between. |
|
There are several components of a phase diagram that are of importance.
- First, of all the point T on the graph above, where all three lines converge, is called the triple point. The triple point is the conditions of pressure and temperature where all three states of matter exist in equilibrium.
- The point C is called the critical point. Beyond the critical point, the pressure and temperature are so high, it is impossible to tell whether the matter is liquid or gas. It has properties of both. Some call it a supercritical fluid at that point.
|
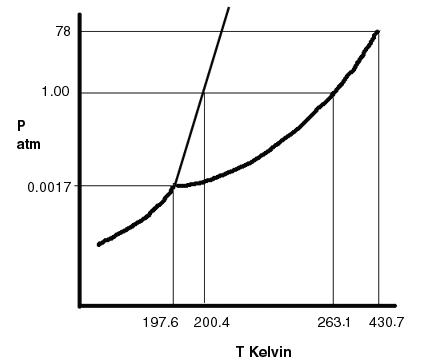
To the left is a phase diagram for sulfur dioxide. Notice that the scale of the pressure and temperature is off. The scale is never right on a phase diagram. The more important is the fork and the one line separating into two and knowing the exact P and T where the points occur.
In almost all cases, the numbers on the axis correspond to the triple point, critical point and 1 atm of pressure, because that would be where the normal boiling and melting points are. For sulfur dioxide, its normal melting point is 200.4 K and normal boiling point is 263.1 K. |
|
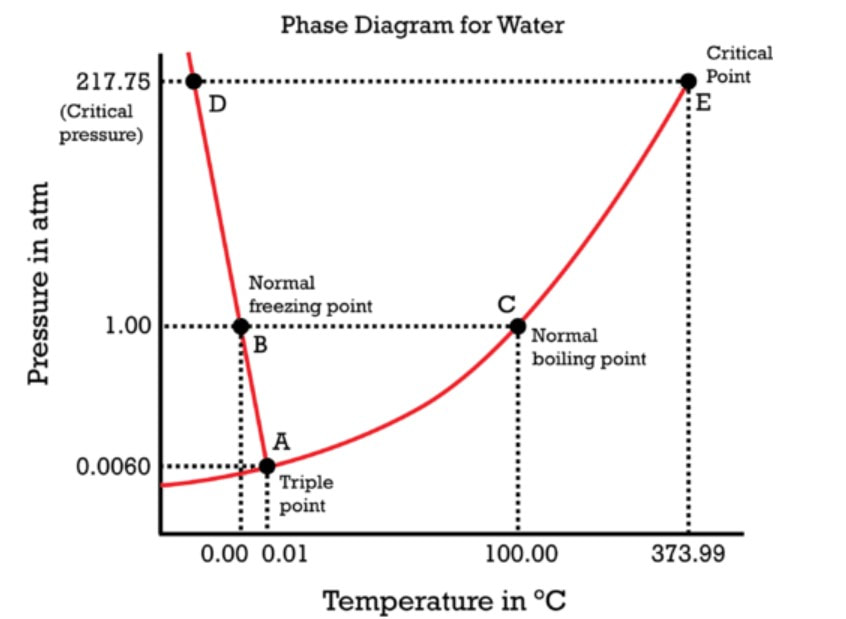
There are a number of special things about water. One is that solid water (ice) is less dense than liquid water. Ice floats on water. For compounds (which there are not many) where the solid form is less dense than the liquid form, the line between liquid and solid will lean to the left on a phase diagram (points A - D) on the graph to the right.
For most other substances, the solid is more dense, so additional pressure will solidify instead of liquify. |
|
